Exploring purchase intentions of packaged food based on Front of Package Label (FOPL) among adult consumers in Chandigarh: A cross sectional study
Original Research Article - (2024) Volume 0, Issue 0
Received: 11-Mar-2024, Manuscript No. CNHD-24-129189; Editor assigned: 13-Mar-2024, Pre QC No. CNHD-24-129189 (PQ); Reviewed: 27-Apr-2024, QC No. CNHD-24-129189; Revised: 03-Apr-2024, Manuscript No. CNHD-24-129189 (R); Published: 10-Apr-2024, DOI: 10.12873/0211-6057.44.S1.002.
Abstract
Introduction: Front of Package Food Labels (FOPL) provide information on the nutrients contained in packaged food items, assisting consumers in making healthier food choices during purchase. Objective to explore the purchase intentions based on FOPL of packaged food among adult consumers in Chandigarh, India.
Materials and methods: Pre-tested, semi structured questionnaire was purposively administered among 183 participants residing in Chandigarh at various confectionary stores during the pint of purchase in May-June 2021. This cross-sectional study included sample of commonly used 51 packaged products of four categories including frying oils, snacks (local and branded), sweets and bakery. The detailed information like FSSAI registration no., brand name, package weight, price of the product, list of ingredients, nutritional value (fat, trans fat, carbohydrate, sugar and protein), nutrition information per serving and nutrition information per 100g, and additional claims if any were recorded from the package. Purchase intention of the consumers was documented under personal, product related and external factors.
Results: It was discovered that customer perception of FOPL regarding cost, expiration date, and Manufacturing (Mfg) date was significant; however, relatively few consumers were found to be paying attention to nutritional information. The respondents’ occupation and level of education were associated with the personal factor of label information. The reasons given for not verifying label information included being in a higher age group, being pressed for time, and not understanding the significance of the label. The consumer choice of items was influenced by product related factors such as pricing, brand name, and advertisement. Doctor recommendations on diet compliance are examples of external factors that affect consumer purchasing.
Conclusion: Consumer purchase intention to check the nutritional information on FOPL is low. We recommend launching a global effort to raise awareness of healthcare issues and implementing uniform FOPL. We also advise conducting evidence-based research and community- based clinical trials to investigate the cause and develop appropriate policy guidelines.
Keywords
Purchase intentions, Packaged food, Front of package label, FoP
Introduction
The prevalence of Non-Communicable Diseases (NCD) also called as silent killers is increasing drastically over the last two decades, contributing to around 41 million global death (2016) with a projection of over 100 million by the end of 2025 [1]. Twenty-eight lives between 30 and 70 years old are lost every minute as a result of NCDs. Of these deaths, 25 out of 28 occur in low- and middle-income nations where there are frequently insufficient safeguards against the risk factors for NCDs, which include inadequate knowledge, attitude and practice of poor diets, alcohol and tobacco use, physical inactivity, and air pollution [2].
Unhealthy food choices have significant impact on development of NCD. Over the past 50 years, there has been a significant shift in people’s eating habits, which is the root cause of unhealthy food intake [3]. On the other hand, because of their flexible attributes, they are highly considered when developing public health initiatives [4-6]. Nutrition labelling on front of the pack (FOPL) is one of the latest structural initiatives aimed at enhancing the food environment and reducing NCD burden [7]. Being a cost effective strategy, FOPL on processed foods are now required in a number of nations throughout the world to improve consumers purchase intention of making healthier food choices [8,9]. They are essential in encouraging food manufacturers to repackage and label their products [10]. Internationally renowned Codex Alimentarius Commission, are hosting a number of conversations regarding the same [11]. Regulations regarding nutrition labelling was implemented by Food Safety Standards Authority of India (FSSAI) in 2011, which was amended 0n 2018 and 2020 further [12].
A range of FOPLs have recently been used. The information on the nutrient content and overall nutritional quality of the food product is provided by the nutrient-specific and summary labels, respectively. Individual nutrient labels fall into three categories: color-coded, numeric-only, and warning label groupings. A few examples of these three types include Reference Intakes (RIs), the UK’s Multiple Traffic Lights (MTL) label and Chile’s Warning labels created in 2006, 2005, and 2016 respectively [13- 15]. The endorsement symbols and scale-based graded labels are further divisions of the summary FOPL. Among the few are the Health Star Rating (HSR) system in Australia and the Nutri-Score system in France, which were created in 2014 and 2017, respectively [16,17]. Customers often appreciate FOPL, and they can increase their awareness of the health benefits of different food items [18,19]. Keeping in mind the importance of FOPL, various studies was conducted evaluating impact of awareness [20,21], understanding [22,23], acceptability [24] and usage [20]. Though there are still scarcity of literature regarding the consumer perception especially in north India. To unveil the curtain, we have conducted this research with an objective to explore the purchase intentions based on Front of Package Label (FOPL) of packaged food among adult consumers in Chandigarh, India.
Materials and Methods
Data collection and study design
A cross-sectional study was carried out to measure purchase intension of consumers. Sample of 51 packaged products of four categories including frying oils, snacks (local and branded), sweets and bakery products which are very commonly used and contains trans-fat were collected.
Trans-fat containing food products from the market were selected including both branded products and locally packaged food products having label on packet. Bakery products like cakes, cookies etc. are also taken into account which are available in bakery shops. The detailed information like FSSAI registration no., brand name, package weight, price of the product, list of ingredients, nutritional value (fat, trans fat, carbohydrate, sugar and protein), nutrition information per serving and nutrition information per 100 g, and additional claims if any were recorded from the package. Cooked products available as servings at restaurants are not taken into account as well as locally available unpackaged food products were excluded from study.
The sample size was calculated based on the formula as follows
n=4pq/d2
Where p=Prevalence or proportion
d=Absolute error of the estimated prevalence (standard error) (0.05)
Considering a non-response rate of 10% final sample of 183 was found to be appropriate.
183 consumers were selected purposively who come to grocery stores, sweet and bakery shops to buy food products and online google forms were filled by them. The study was provided in Figure 1.

Figure 1: Sampling study flow diagram consumers purchasing food products
Inclusion criteria
Adult consumers (>18 years) from both genders were included with basic understanding of regional language of Chandigarh. Trans-fat containing food products from the market was selected including both branded products and locally packaged food products having label on packet. Bakery products like cakes, cookies etc. were also taken into account available in bakery shops.
Exclusion criteria
Cooked products available as servings at restaurants were not taken into account as well as locally available unpackaged food products were excluded from study.
Data collection tools
The data was taken from the consumers visiting the confectionary stores through a google form questionnaire including basic demographic details and the responses regarding the label perception. Informed consent was taken verbally from the participants and the participants who were not able to fill the questionnaire online were given printed form.
Statistical analysis: Data were analyzed using Stata v15 (StataCorp LLC, College Station, TX). Characteristics of participants were described as frequencies and percentages for categorical variables (gender, age-group, occupation). Chi-square statistics were used to the association between categorical variables. P-value <0.05 was considered statistically significant.
Ethics: Ethical clearance was obtained from Institute Ethical committee of Postgraduate Institute of Medical Education and Research, Chandigarh, India. (IEC NO. NIK/7129/MPH/242).
Results
The product list includes 51 items that were examined to ensure label compliance. These items were sorted into four main groups, including bakery goods and chocolates, sweets, frying oil, and afternoon snacks. There were two categories of afternoon snacks: Branded and unbranded. Unbranded refers to food that has been packaged locally, whereas branded refers to the packaging of goods that have been sold under a particular brand name (Supplementary Table S1).
It was clear that 39.3% of the respondents spare their time to shop eatables because they were concerned about their health while 60.7% of them consider it important to see label. Results shows that 99.5% respondents purchase by seeing advertisements while cost and trust on brands contribute to 89.1% and 83.6% respectively. Respondents who considered time as constraint to see label information accounted for 68.3% and 39.9% of the respondents do not consider it important to see label information. Overall advertisements and brand trust accounted for the main reasons for not putting emphasis was on label information in Table 1.
| Reason behind seeing label information (N=183) | N (%) | |
|---|---|---|
| It is important | 111 (60.7%) | |
| I spare my time to shop eatables because I am | 72 (39.3%) | |
| Reason behind not seeing label information | N (%) | |
| Person related factors | It is not important | 73 (39.9%) |
| I do not have time to see label | 125 (68.3%) | |
| Product related products | Cost is more important | 163 (89.1%) |
| I trust on high selling brands | 153 (83.6%) | |
| I purchase by seeing advertisements | 182 (99.5%) | |
| External factors | Doctor instructions to follow diet | 18 (9.8%) |
There was an association between habit of seeing label as per the instructions of doctor and gender with a χ2 value (df=1, N=183)=7.371, p value=0. 007. This means that both genders have denied of following the doctor in-structions by seeing label. The association between employment and following doctor instructions of diet as a reason to see label and it was found to be significant with a χ2 value=(df=6, N=183)=15.795, p value=0.015. The result shows that with higher employment status there was more chances to follow diet instruction given by doctor by seeing label, however most people were denying for it as a reason to see label information. The association between education and perception of considering label information important by the respondents. The results shows that there was an association between education and the understanding of label information importance to the respondents with a χ2 value (DF=1, N=183)=6.724, p value=0.010. It was clear that with the higher education level perception of considering label information important was higher.
The reasons for not seeing label were also checked for significance level and revealed that other demographic factors except age were not significantly associated with personal factors such as no concern with importance of label and time constraint while shopping. However, if the frequency percent was observed, age, education and employment were having more than 85.40%, 79.4% and 84.1% having more personal factor influence on not seeing label, respectively in Table 2.
| Reason behind seeing not label | Personal factors influence is more | Personal factor influence is less | P value | Product factors influence is more | Product factor influence is less | P value |
|---|---|---|---|---|---|---|
| Gender | 0.637 | |||||
| Male | 43 (52.4%) | 54 (53.5%) | 0.457 | 30 (50.0%) | 65 (53.7%) | |
| Female | 39 (47.6%) | 47 (46.5%) | 30 (50.0%) | 56 (46.3%) | ||
| Age group (years) | 0.106 | |||||
| Less than 30 | 70 (85.40%) | 62 (61.40%) | <0.001 | 48 (80.0%) | 83 (68.6%) | |
| More than 30 | 12 (14.6%) | 39 (38.60%) | 12 (20.0%) | 38 (31.4%) | ||
| Monthly income | 0.318 | |||||
| <30000 | 41 (50%) | 55 (54.50%) | 0.548 | 28 (46.7%) | 66 (54.5%) | |
| >30000 | 41 (50.0%) | 46 (45.5%) | 32 (53.3%) | 55 (45.5%) | ||
| Employment | 0.558 | |||||
| Skilled worker | 13 (15.9%) | 25 (24.8%) | 0.87 | 24 (40.0%) | 43 (35.5%) | |
| Professionals | 69 (84.1%) | 76 (75.2%) | 36 (60.0%) | 78 (64.5%) | ||
| Education | 0.536 | |||||
| Up to secondary level | 33 (20.60%) | 5 (21.70%) | 0.140 | 11 (18.3%) | 27 (22.3%) | |
| Tertiary level | 127 (79.40%) | 18(78.30%) | 49 (81.7%) | 94 (77.7%) | ||
The consumption of bakery products and sweets was found to be maximum followed by the snacks. The percentage of respondents who were consuming bakery products was 80.3% while sweets consumption was done by 77.6% of them and snacks were consumed by 59% respectively. The respondents who buy snacks, bakery products and sweets. It also depicts the frequency of buying sweets, bakery products /chocolates and snacks with the responses as daily, very frequently, less frequently, sometimes on occasions and never. The results show that highest frequency of buying sweets was on occasions and for bakery products highest frequency was frequently in a week with a percentage of 48%. Snacks were bought frequently in a week with a percentage 53%. Overall bakery products were bought highest on daily routine followed by snacks. Responses for never buying the snacks was also highest (10.4%) followed by bakery products (6.6%) and sweets (2.2%) (Table 3).
| Products | Sweets | Bakery products/chocolates | Snacks |
|---|---|---|---|
| Do you buy these products | Frequency (Percentage) | Frequency (Percentage) | Frequency (Percentage) |
| Yes | 142 (77.6%) | 147 (80.3%) | 108 (59%) |
| No | 41 (22.4%) | 36 (19.7%) | 75 (41%) |
| Frequency of buying these products | |||
| Daily | 3 (1.6%) | 29 (15.8%) | 23 (12.6%) |
| Frequently in a week | 90 (49.2%) | 88 (48.1%) | 98 (53.5%) |
| On occasions | 56 (30.6%) | 52 (28.4%) | 40 (21.9%) |
| Never | 4 (2.2%) | 12 (6.6%) | 19 (10.4%) |
Bakery products were bought frequently by more than 30 years age group with a highest percentage 52.9% and for below 30years age group 46.9% followed by occasional purchase with 29.2% for less than 30year age group while 27.5% for more than 30 years of age group. Age and frequency of buying snacks were associated with a χ2 value (df=16, N=180)=30.605, p value=0.015 and less than 30 years age group buy more snacks (56.9%) than of age above 30 years (48%) more snacks than other age groups and snacks were bought frequently. Significant association between employment and snacks frequency with χ2 value (df=24, N=180) =42.132, P value=0.012. Professionals do buy snacks (9.6%) about one half of the skilled workers (19.2%) while almost half of both buy snacks frequently as shown in Figure 2.

Figure 2: Frequency of buying snacks, bakery products and sweets according to age 
Monthly family income was significantly associated with snacks frequency with a χ2 value (df=12, N=180)=39.845, p value=0.001. The daily buying frequency of the higher income group (>30000) was 3 percent more than lower income group (<30000). Education status and snacks buying frequency were significantly associated with a p value 0.028. Less educated buy snacks more frequently (26.3%) than those having tertiary education (9.3%). There was significant association between employment and bakery frequency with a χ2 value (df=24, N=181)=37.343, p value=0.040. It was clear that professionals and skilled groups were buying bakery products 45.3% and 15% respectively more frequently as compared to others however, professionals buy bakery products 39.2% frequently. There was significant association between education status and bakery frequency with a χ2 value (df=4, N=181)=12.467, p value=0.014. It was clear that higher the education status buys 79% of bakery products were bought and 64.1% more frequently than less educated respondents. There was significant association between income status and bakery products buying frequency with χ2 value (df=12, N=181)=23.621, p value=0.035. This clearly depicts that 30.4% of the bakery products were bought by income group less than 30000 which was the highest and followed by 23.8% by the highest income group (Table 4).
| Frequency of buying snacks | Frequency of bakery products | |||||||
|---|---|---|---|---|---|---|---|---|
| Buying snacks | Daily | Frequency | On occasions | P value | Daily | Frequency | On occasions | P value |
| Age group (years) | ||||||||
| Less than 30 | 13.80% | 56.90% | 19.2% | 0.015* | 13.80% | 55.90% | 19.20% | 0.015* |
| More than 30 | 10% | 48% | 30% | 10% | 48% | 30% | ||
| Monthly income | ||||||||
| <30000 | 38.50% | 60% | 3.50% | 0.001* | 23.20% | 47.40% | 23.20% | 0.035* |
| >30000 | 38.90% | 55.60% | 5.60% | 8.10% | 50% | 34.90% | ||
| Employment | ||||||||
| Skilled worker | 18.20% | 53.00% | 22.70% | 0.012* | 21.20% | 47% | 27.30% | 0.040* |
| Professionals | 9.60% | 55.30% | 21.90% | 13.00% | 49.60% | 29.60% | ||
| Education | ||||||||
| Up to secondary level | 26.30% | 52.60% | 15.80% | 0.028* | 31.60% | 31.60% | 31.60% | 0.014* |
| Tertiary level | 9.20% | 54.90% | 23.90% | 11.90% | 53.10% | 28% | ||
Note: *p-value <0.05 statistically significant
Only 32.2% participants were observed who always check nutritional information on label of branded products. Whereas those who sees the information when they have time were 49.7% and those who do not see the information at all were accounted for 3.8%. Chi square test has been applied to see whether there is an association between education and consumer practice to see nutritional information, which is found to be significant with χ2 (df=2, N=183)=6.561, p=0.038. The result shows that respondents having tertiary education were more interested to see nutritional information while buying food products (Figure 3).

Figure 3: Frequency and percentage of respondents who see label and nutritional information 
Discussion
The manufacturing date, expiry date, and cost of a product are proven to be key indicators of consumer perception in label information; very few consumers were found to be paying attention to nutritional information. Still the consumer perception was not satisfactory which might lead to poor health outcomes. For the consumer to make an informed decision before making a purchase, the nutritional composition of any packaged food is essential information [25]. Similar results were documented by Bhattacharya et al. [26].
The study found that there were two categories of reasons people checked labels 1. Factors relating to the individual (trust, perception, knowledge, and comprehension) 2. Factors linked to the product (brand trust, cost, and advertisements). The respondents’ occupation and educational background were linked to the personal factors of viewing label information. Similar results were documented by various studies [26-28]. The relatively busier lifestyle of employed people might lead to intake of packaged foods [26]. Higher educated customers find it simpler to read and comprehend food labels than do less educated ones [29].
The reasons given for not verifying label information included being in a higher age group, being pressed for time, and not understanding the significance of the label. People’s cognitive capacities and visual acuity may deteriorate with age. The little text on labels can be difficult to see and understand. Furthermore, elderly persons might not prioritise carefully reading labels since they have established dietary habits. It takes a few extra minutes to thoroughly check labels, which may not be possible when hurrying through buying packaged food. Nutritional labels can be confusing, particularly to people who are not familiar. Customers may become confused by terms like “daily value,” “serving size,” and “percentages.” People might bypass label verification if they don’t understand the value of these facts [30,31].
Cost, brand name, and advertisements were product-related factors that have been found to influence consumers’ purchase choices. Cost is a major factor in many consumer purchase decisions. When money is tight, individuals can put affordability ahead of carefully reading labels. There are those who believe that things that cost more are necessarily of greater quality or more nutritious. They might therefore neglect thorough label inspections. Reputable brands inspire familiarity and trust. Customers may rely on the quality and safety of their preferred brands, assuming consistency. Well-known brands serve as mental shortcuts. People might not check labels because they think a reputable brand will suit their tastes. Market decisions can be influenced by clever advertising strategies. When a product is widely marketed as “healthy,” people may choose to ignore the label. Sensible judgement can be superseded by emotional advertisements. Customers might give brand sentiments more weight than accurate information [32,33].
Dietary recommendations from doctors were examples of external factors that affect consumer purchases. Recommendations for particular dietary habits by medical professionals frequently result in gaining trust, authority, improvement of health consciousness, positive behavioural impact and improve risk perception. It might lead to set positive log term health goals. Thus, doctors are essential in influencing dietary preferences and encouraging the consumption of healthy foods [34,35].
Daily buying snacks/ bakery products were more among participants aged <30 years, higher monthly income (>30000 INR), skilled workers and educated up to secondary level. Other studies documented usage of food labels while buying decreased with increase in age [36,37]. This was probably due to lower comprehensibility of elderly [38] for which FOPL became more difficult to interpret [39]. Due to rapid urbanization, sedentary lifestyle, decreased physical activity, busy life leading to less personal time might be the possible reasons [26].
The strength of our study was first time exploration of the purchase intention of the consumer by checking FOPL in Chandigarh. Our study had some limitations. Study population was taken purposively so the results cannot be generalized to the whole population. The products were sampled were not enough which make it less generalizable to all the products. Time to fill the questionnaire by consumers who came to buy products could affect the results. Recall bias and social desirability bias could not be ignored. Being a cross-sectional study, temporality could not be established.
Recommendation: FOPL is widely regarded as a powerful and direct tool that Indian officials might use to dissuade the consumption of processed foods. It could be used to curb the rising intake of processed foods that are heavy in sugar, fat, and sodium. It is in charge of the rising non-communicable disease burden. Interesting designs are being used for FOPL in a number of nations, including Denmark, Chile, Norway, Singapore, South Africa, Ecuador, and so on. There is not global homogeneity in the FoP label system. Rather, many nations employ distinct labelling schemes based on their individual viability and the most common sociodemographic profiles of the populace, including literacy about health and nutrition, general awareness, education, and many other areas. We recommend healthcare awareness campaign and implementation of homogeneous FOPL all over the globe. We further recommend Community based clinical trials and evidence-based research to explore the causation and to formulate proper policy guidelines.
Conclusion
Consumer perception in relation to label information found to be significant for Manufacturing (Mfg.) date, expiry date and cost, while very less consumer found to be paying attention to nutritional information. Cost and expiry date was found most significant to be checked by the customer. Reasons behind checking label were of two types that were observed in the study as personal factors (trust, perception, knowledge and understanding) and products related factors (brand trust, cost, and advertisements).
Personal factor of seeing label information was associated with employment and education of the respondents. Higher age group, time constraint and lack of knowledge about importance of label were provided as reason behind not checking label information. Product related factors were found to have impact on consumer choice of products was advertisements, brand name and cost. External factors which influence consumer purchases was doctor instructions to follow diet. Daily buying snacks/ bakery products were more among participants aged <30 years, lower monthly income (>30000 INR), skilled workers and educated up to secondary level.
References
- Moraga P. GBD 2016 causes of death collaborators global, regional, and national age-sex specific mortality for 264 causes of death, 1980-2016: A systematic analysis for the global burden of disease study 2016. Lancet. 2017;390(10100):1151-1210.
- On the road to 2025, Geneva, Switzerland. World Health Organ. 2024.
- Roy R, Alassadi D. Does labelling of healthy foods on menus using symbols promote better choices at the point-of-purchase?. Public Health Nutr. 2021;24(4):746-754.
[Crossref] [Google Scholar] [Indexed]
- Diet, nutrition and the prevention of chronic diseases. World Health Organ Tech Rep Ser. 2003;916(i-viii):1-49.
- Lim SS, Vos T, Flaxman AD, Danaei G, Shibuya K, Adair-Rohani H, et al. A comparative risk assessment of burden of disease and injury attributable to 67 risk factors and risk factor clusters in 21 regions, 1990-2010: A systematic analysis for the Global burden of disease study 2010. Lancet. 2012;380(9859):2224-2260.
[Crossref] [Google Scholar] [Indexed]
- Global health risks: Mortality and burden of disease attributable to selected major risks. World Health Organiz. 2009.
- Branca F, Lartey A, Oenema S, Aguayo V, Stordalen GA, Richardson R, et al. Transforming the food system to fight non-communicable diseases. BMJ. 2019;364:l296.
[Crossref] [Google Scholar] [Indexed]
- Kanter R, Vanderlee L, Vandevijvere S. Front-of-package nutrition labelling policy: Global progress and future directions. Public Health Nutr. 2018;21(8):1399-1408.
- Cecchini M, Warin L. Impact of food labelling systems on food choices and eating behaviours: A systematic review and meta‐analysis of randomized studies. Obes Rev. 2016;17(3):201-210.
- Young L, Swinburn B. Impact of the pick the tick food information programme on the salt content of food in New Zealand. Health Promot Int. 2002;17(1):13-19. [Crossref]
- Joint FAO/WHO food standards programme codex committee on food labelling. Food Agricul Organiz. 2016.
- FSSAI plans to introduce 'front of package label' to regulate junk foods. Busin Stand News. 2021.
- Carreño I. Chile's black stop sign for foods high in fat, salt or sugar. Eur J Risk Regul. 2015;6(4):622-628.
- Front-of-pack traffic light signpost labelling technical guidance. Food Stand Agen. 2007.
- Dietary guidance. Human Nutri Food Saf.2021
- About star ratings. Health aged care.2024
- Julia C, Etilé F, Hercberg S. Front-of-pack nutri-score labelling in France: An evidence-based policy. Lancet Pub Health. 2018;3(4):E164.
[Crossref] [Google Scholar] [Indexed]
- Hawley KL, Roberto CA, Bragg MA, Liu PJ, Schwartz MB, Brownell KD. The science on front-of-package food labels. Public Health Nutr. 2013;16(3):430-439.
- Hersey JC, Wohlgenant KC, Arsenault JE, Kosa KM, Muth MK. Effects of front-of-package and shelf nutrition labeling systems on consumers. Nutr Rev. 2013;71(1):1-4.
[Crossref] [Google Scholar] [Indexed]
- Correa T, Fierro C, Reyes M, Dillman Carpentier FR, Taillie LS, Corvalan C. Responses to the Chilean law of food labeling and advertising: Exploring knowledge, perceptions and behaviors of mothers of young children. Int J Behav Nutr Phys Act. 2019;16:1-10.
- Vargas-Meza J, Jáuregui A, Contreras-Manzano A, Nieto C, Barquera S. Acceptability and understanding of front-of-pack nutritional labels: An experimental study in Mexican consumers. BMC Pub Health. 2019;19:1-2.
- Reyes M, Garmendia ML, Olivares S, Aqueveque C, Zacarías I, Corvalán C. Development of the Chilean front-of-package food warning label. BMC public health. 2019;19:1-1.
- Khandpur N, Sato PD, Mais LA, Martins AP, Spinillo CG, Garcia MT, et al. Are front-of-package warning labels more effective at communicating nutrition information than traffic-light labels? A randomized controlled experiment in a Brazilian sample. Nutrient. 2018;10(6):688.
[Crossref] [Google Scholar] [Indexed]
- de Morais Sato P, Mais LA, Khandpur N, Ulian MD, Bortoletto Martins AP, Garcia MT, et al. Consumers’ opinions on warning labels on food packages: A qualitative study in Brazil. PLoS One. 2019;14(6):e0218813.
[Crossref] [Google Scholar] [Indexed]
- Rajni pandey, Kritika. Consumer awareness of nutritional labelled foods. J Emerg Tech Innov Res. 2022
- Bhattacharya S, Bera OP, Shah V. Consumers' perception about Front Of Package food Labels (FOPL) in India: A survey of 14 states. Front Pub Health. 2022;10:936802.
[Crossref] [Google Scholar] [Indexed]
- Brecher SJ, Bender MM, Wilkening VL, MccABE NM, Anderson EM. Status of nutrition labeling, health claims, and nutrient content claims for processed foods: 1997 food label and package survey. J Am Diet Assoc. 2000;100(9):1057-1062.
[Crossref] [Google Scholar] [Indexed]
- Fard NA, Morales GD, Mejova Y, Schifanella R. On the interplay between educational attainment and nutrition: A spatially-aware perspective. EPJ data science. 2021;10(1):18.
- Singla M. Usage and understanding of food and nutritional labels among Indian consumers. British Food J. 2010;112(1):83-92.
- Sajdakowska M, Gębski J, Wardaszka A, Wieczorek A. Evaluation of food labelling the products with information regarding the level of sugar: A preliminary study. Nutrient. 2022;14(13):2697.
- Becker MW, Bello NM, Sundar RP, Peltier C, Bix L. Front of pack labels enhance attention to nutrition information in novel and commercial brands. Food policy. 2015;56:76-86.
[Crossref] [Google Scholar] [Indexed]
- Choi S, Lee S, Friske W. The effects of featured advertising and package labeling on sustainability of Cause-Related Marketing (CRM) products. Sustainabil. 2018;10(9):3011.
- Marchini A, Riganelli C, Diotallevi F, Polenzani B. Label information and consumer behaviour: Evidence on drinking milk sector. Agricul Food Econ. 2021;9(1):8.
- Downer S, Berkowitz SA, Harlan TS, Olstad DL, Mozaffarian D. Food is medicine: Actions to integrate food and nutrition into healthcare. BMJ. 2020;369:m2482.
[Crossref] [Google Scholar] [Indexed]
- Thomas PR. Health-care professionals: Strategies and actions for implementation. Improv Am Diet Health. 1991.
- Kim SY, Nayga Jr RM, Capps Jr O. The effect of food label use on nutrient intakes: An endogenous switching regression analysis. J Agric Resour Econ. 2000:215-231.
- Balasubramanian SK, Cole C. Consumers' search and use of nutrition information: The challenge and promise of the nutrition labeling and education act. J Mark. 2002;66(3):112-127. [Crossref]
- Andrews JC, Netemeyer RG, Burton S. The nutrition elite: Do only the highest levels of caloric knowledge, obesity knowledge, and motivation matter in processing nutrition ad claims and disclosures?. J Public Policy Mark. 2009;28(1):41-55.
- Drichoutis AC, Lazaridis P, Nayga Jr RM. Consumers' use of nutritional labels: A review of research studies and issues. Acad mark Sci Rev 2006;2006:1.
Author Info
Sunita Verma1, Pritam Halder2, Sonu Goel2, Rachana Srivastava2 and Poonam Khanna2*2Department of Community Medicine and School of Public Health, Postgraduate Institute of Medical Education and Research, Chandigarh, India
Copyright: This is an open access article distributed under the terms of the Creative Commons Attribution License, which permits unrestricted use, distribution, and reproduction in any medium, provided the original work is properly cited.

0.7
2022 CiteScore

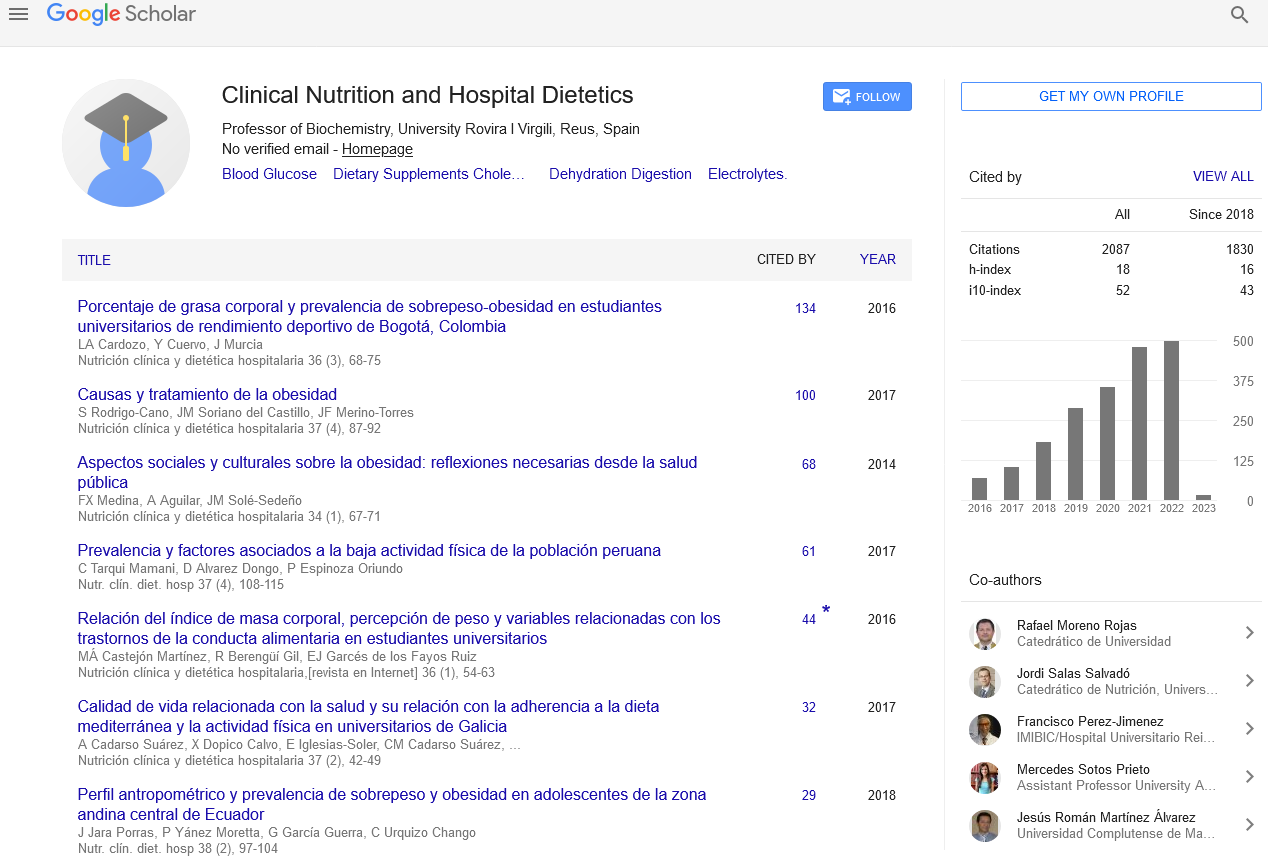
Google Scholar citation report
Citations : 2439
Clinical Nutrition and Hospital Dietetics received 2439 citations as per google scholar report
Indexed In
- Google Scholar
- Open J Gate
- Genamics JournalSeek
- Academic Keys
- JournalTOCs
- ResearchBible
- SCOPUS
- Ulrich's Periodicals Directory
- Access to Global Online Research in Agriculture (AGORA)
- Electronic Journals Library
- RefSeek
- Hamdard University
- EBSCO A-Z
- OCLC- WorldCat
- SWB online catalog
- Virtual Library of Biology (vifabio)
- Publons
- MIAR
- Geneva Foundation for Medical Education and Research
- Euro Pub
- Web of Science
Journal Highlights
- Blood Glucose
- Dietary Supplements
- Cholesterol, Dehydration
- Digestion
- Electrolytes
- Clinical Nutrition Studies
- energy balance
- Diet quality
- Clinical Nutrition and Hospital Dietetics