SNAI1 as a biomarker for prognostic prediction and targeted therapy in lung squamous cell carcinoma
Research Article - (2024) Volume 44, Issue 2
Received: 03-Jun-2024, Manuscript No. CNHD-24-137915; Editor assigned: 05-Jun-2024, Pre QC No. CNHD-24-137915 (PQ); Reviewed: 19-Jun-2024, QC No. CNHD-24-137915; Revised: 26-Jun-2024, Manuscript No. CNHD-24-137915 (R); Published: 03-Jul-2024, DOI: 10.12873/0211-6057.44.02.221
Abstract
Background: This study investigates the role and potential molecular mechanisms of the SNAI1 gene in Lung Squamous Cell Carcinoma (LUSC) and its application in molecular targeted therapy.
Methods: Bioinformatics analysis, including TCGA, TPA, GSEA and CellMiner analysis, was conducted to analyze the expression levels of the SNAI1 gene in normal and tumour tissues, their correlation with clinical outcomes and potential targeted drugs.
Results: In normal human tissues, SNAI1 was significantly highly expressed in lung tissues compared to other tissues. However, in LUSC, its expression was significantly downregulated. High expression of SNAI1 mRNA was associated with poor Overall Survival (OS) and Disease-Free Survival (DFS). The expression level of SNAI1 mRNA was also associated with age, tumour size, lymph node metastasis and distant metastasis in LUSC patients. A nomogram was constructed to predict the survival of LUSC patients. Furthermore, high expression of the SNAI1 protein in LUSC was associated with poor prognosis. The 5-year survival rate was 37% in the high expression group and 59% in the low expression group. The main subcellular localization of SNAI1 protein in LUSC tissue cells was the nucleus, but strong protein expression also led to its localization in the cytoplasm and membrane. Gene Set Enrichment Analysis (GSEA) revealed a relevance between SNAI1 and TP53 signaling pathway in LUSC. SNAI1 can interact with TP53 and HDAC. By utilizing the CellMiner platform, a wide range of compounds that could potentially target SNAI1, including mTOR, were explored. Therefore, potential targeted drugs for SNAI1 include epigenetic modifications inhibitors and mTOR. Studies have shown that these targeted SNAI1 agents hold promise for the treatment of LUSC.
Conclusion: High expression of the SNAI1 gene is significantly associated with poor OS and DFS outcomes in LUSC patients. SNAI1 serves as an independent prognostic factor for LUSC and can be used as a biomarker for prognostic prediction. SNAI1 holds promise for the treatment of LUSC.
Keywords
Protein, Zinc, Lung cancer, Zinc finger protein family, Lung squamous cell carcinoma, SNAI1, TP53
Introduction
Lung cancer is one of the most common and deadliest malignant tumours worldwide. The exact mechanisms underlying its development remain unclear and long- term survival rates are low. According to global cancer reports published annually, lung cancer ranks first in both incidence and mortality among malignant tumours. In China, lung cancer also holds the top position in terms of incidence and cause of death, posing a significant threat to the health of our population. The burden of this disease is substantial, making its prevention and control efforts highly challenging.
Squamous cell carcinoma, adenocarcinoma, small cell carcinoma and large cell carcinoma are the most frequent pathological types of lung cancer, accounting for over 90% of cases [1-4]. However, despite their prevalence, the precise mechanisms driving lung carcinogenesis remain poorly understood. Current treatment options yield unsatisfactory outcomes with low long-term survival rates.
Snail Family Transcriptional Repressor 1 (SNAI1) belongs to the zinc finger protein family and plays diverse roles in tumour initiation, progression, drug resistance and stemness properties [5-10]. Previous studies conducted by our research group have highlighted the significant biological functions of SNAI1 in normal and tumour tissues. Therefore, this study aims to explore the role of SNAI1 and its potential molecular mechanisms in LUSC.
Materials and Methods
NIH/NCBI database analysis
We analyzed the expression of SNAI1 in normal lung tissue by accessing the databases provided by the National Institutes of Health (NIH) and the National Center for Biotechnology Information (NCBI) through their website (https://www.ncbi.nlm.nih.gov/gene/6615).
GEPIA2 database analysis
We utilized the GEPIA2 database (http://gepia2.cancerpku. cn), which is a comprehensive resource for analyzing gene expression patterns. The database includes a total of 9,736 tumour samples and 8,587 normal tissue samples from both The Cancer Genome Atlas (TCGA) project and Genotype-Tissue Expression (GTEx) project. In the functional module, we used single-gene analysis to investigate the expression of SNAI1 in various cancers as well as normal tissues, examining its relationship with clinical staging, Overall Survival (OS) and Disease- Free Survival (DFS). Default thresholds were chosen as reference values.
TCGA database
We downloaded gene expression data and clinical data for LUSC from The Cancer Genome Atlas (TCGA) database and merged them using R-4.2.2 software.
The differentially expressed genes between LUSC patients and healthy controls were analyzed using the LIMMA package, by setting the threshold to greater than 2-fold and an adjusted p-value less than 0.01.
The differentially expressed genes between the high and low expression of SNAI1 in LUSC patients were analyzed using the LIMMA package, by setting the threshold to greater than 2-fold and an adjusted P-value less than 0.01.
The human protein atlas analysis
SNAI1 protein expression in patients with lung squamous cell carcinoma: The human protein atlas database (https:// www.proteinatlas.org/) serves as a valuable resource for SNAI1 protein expression patterns in various tissues and tumour samples. By analyzing the immunohistochemistry data provided by this database, the expression profile of SNAI1 protein specifically in patients with LUSC were examined.
The subcellular localization patterns of SNAI1 protein in LUSC tissues were analyzed through the provides comprehensive immunohistochemistry data on the human protein atlas database.
X-tile software analysis
We performed optimal cut-off value analysis on SNAI1 gene expression in LUSC patients using X-tile software to determine prognostic stratification levels. The expression levels of SNAI1 gene were categorized into high, medium and low groups and their correlation with survival rates was explored using Kaplan-Meier survival curves.
String protein-protein
Interaction analysis to further investigate the proteinprotein interaction network of SNAI1, we utilized the information provided by the string database (https:// string-db.org/).
Gene Set Enrichment Analysis (GSEA)
Using GSEA 4.0.3 software, we performed gene set enrichment analysis on gene expression data from LUSC samples in the TCGA database.
Screening potential molecular targeted drugs for SNAI1 using CellMiner
By querying the database with SNAI1 as the target gene, a list of compounds that have shown significant efficacy against cell lines exhibiting high expression levels of SNAI1. These compounds may represent potential candidates for targeted therapy aimed at inhibiting or modulating the function of SNAI1 in cancer cells.
Statistical analysis
Statistical analyses were performed using IBM SPSS 26.0 Software. The Mann-Whitney U test was used to compare numerical data, while the chi-square test was employed for comparing categorical data. Survival analysis was conducted using the Kaplan-Meier method along with the log-rank test. Univariate and multivariate Cox proportional hazard models were constructed to assess Overall Survival (OS) using a limited backward elimination procedure. The Nomogram plot was build for predicting the Overall Survival (OS) of cancer patients by R programming language packages such as survival and rms. All statistical tests were two-tailed and a significance level of p<0.05 was considered statistically significant.
Results
SNAI1 is highly expressed in normal lung tissue
Transcriptional analysis was performed using highthroughput sequencing of RNA samples from 16 different normal human tissues, including both individual and pooled samples (utilizing the Illumina bodyMap2 transcriptome) within the NCBI database under the biological project PRJEB2445, it was found that in normal human tissues, the expression level of the SNAI1 gene is approximately 7.0 RPKM (Reads Per Kilobase Million). Importantly, among these normal human tissues, the expression of the SNAI1 gene in lung tissue exhibited a significantly higher level compared to other tissues. These findings suggest that the SNAI1 gene plays an important and specific role in normal lung tissue cells at a molecular level (Figure 1A). Data analysis using GEPIA2 also reveals that SNAI1 exhibits the highest expression level in lung tissues among normal tissues (Figure 1B). This suggests that SNAI1 plays an important role in the physiological functions of the lungs.
Figure 1. Expression of SNAI1 in normal and tumor tissues. Note: A) Expression levels of the SNAI1 gene across various types of normal human organs along with their respective standard deviations; B) Expression of SNAI1 in normal and tumor tissues; C,D) Expression of SNAI1 in lung squamous cell carcinoma and its expression across different stages.
Downregulation of SNAI1 expression in LUSC
To investigate the expression of SNAI1 in both normal and tumour tissues, analysis was conducted on LUSC data from the TCGA database. Relative to normal control tissues, abnormal expression of SNAI1 was observed across various tumours. Notably, significant downregulation of SNAI1 was observed in both LUSC and lung adenocarcinoma (Figures 1B and 1C).
The relationship between SNAI1 expression and different clinical stages was also examined. Analysis of SNAI1 expression levels across different clinical stages of LUSC indicated that there were no statistically significant differences at a systems level; however, it was found that the expression levels increased with higher clinical stage progression (Figure 1D).
SNAI1 is significantly associated with OS and DFS in LUSC
Analysis of data from the TCGA database on LUSC, as well as clinical data, revealed a significant correlation between high expression of the SNAI1 gene and poor Overall Survival (OS) and Disease-Free Survival (DFS) in patients (Figures 2A-2C). The analysis demonstrated that patients with high expression levels of the SNAI1 gene exhibited lower OS rates compared to those with low expression levels. Similarly, these patients also experienced shorter DFS times, indicating an unfavorable prognosis associated with increased SNAI1 gene expression. These findings underscore the potential prognostic value of evaluating SNAI1 expression levels in LUSC patients. High expression of the SNAI1 gene appears to be indicative of a more aggressive disease phenotype and may serve as a useful biomarker for predicting patient outcomes.
Figure 2. Association of SNAI1 gene expression with survival prognosis in lung squamous cell carcinoma. Note: A) Significant correlation of SNAI1 with survival in various other tumors; B,C) Significant correlation of SNAI1 with OS and DFS in lung squamous cell carcinoma, ( ): Low SNAI1 group; (
 ): High SNAI1 group; D-H) The correlation between different expression groups of SNAI1 and patient survival prognosis in lung squamous cell carcinoma through X-tile software analysis.
Association of SNAI1 mRNA expression with survival prognosis in LUSC
To analyze the association between SNAI1 mRNA expression and survival prognosis in LUSC, we merged the expression data of the SNAI1 gene from TCGA database with clinical data using R programming software. The merged dataset was then subjected to survival analysis using X-tile software. The results revealed that the expression levels of the SNAI1 gene could be divided into three groups: High, medium and low. The optimal cutoff values for each group were determined to be 2.57 and 6.86. Accordingly, based on these cut-off values, the SNAI1 gene expression was categorized into high, medium and low three groups. Further analysis was conducted using Kaplan-Meier survival curves to assess the correlation between different expression groups of SNAI1 and patient survival prognosis in LUSC. These groups exhibited significant differences in their survival curves. The 5-year survival rates were 20.6%, 37.3% and 58% respectively. The median survival times for these groups were 1.7 years, 3.1 years and not reached. The results demonstrated a significant association between high/medium/low expression groups of the SNAI1 gene and survival outcomes (Figures 2D-2H). This suggests that variations in SNAI1 gene expression can serve as potential prognostic indicators for patients with LUSC.
SNAI1 is also significantly associated with poor survival in various other tumours
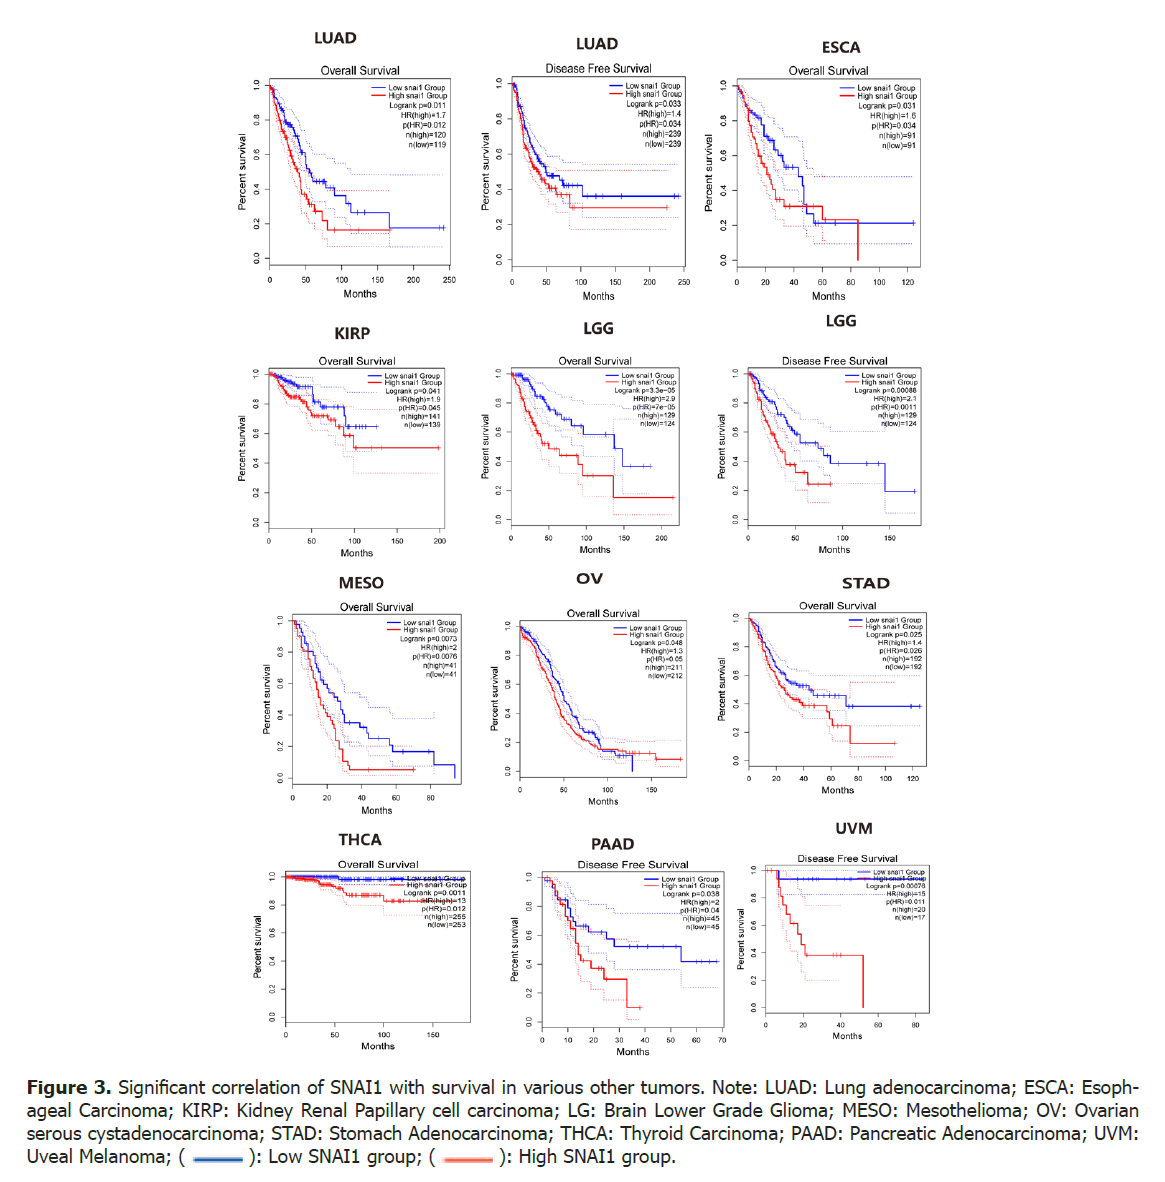
Through the analysis of data from the TCGA database and clinical information pertaining to multiple tumour types, it was discovered that, apart from LUSC, high expression of the SNAI1 gene is significantly correlated with low Overall Survival (OS) and Disease-Free Survival (DFS) rates in several other malignancies. These include lung adenocarcinoma, colon adenocarcinoma, esophageal cancer, low-grade glioma of the brain, ovarian serous cystadenocarcinoma, gastric adenocarcinoma, thyroid cancer, pleomorphic glioblastomas multiforme as well as renal papillary cell carcinoma. These findings suggest that increased expression of SNAI1 gene contributes to an unfavorable prognosis for patients across a diverse range of malignant tumours. The observed correlation between SNAI1 expression and OS/DFS highlights its potential role as a prognostic biomarker in various pathological subtypes such as squamous cell carcinoma, adenocarcinomas (lung adenocarcinoma, colon adenocarcinoma), neuroepithelial neoplasms (low-grade glioma, biphasic glioblastomas) and other tumour types (renal papillary cell carcinoma, malignant mesotheliomas) (Figure 3).
Figure 3. Significant correlation of SNAI1 with survival in various other tumors. Note: LUAD: Lung adenocarcinoma; ESCA: Esophageal Carcinoma; KIRP: Kidney Renal Papillary cell carcinoma; LG: Brain Lower Grade Glioma; MESO: Mesothelioma; OV: Ovarian serous cystadenocarcinoma; STAD: Stomach Adenocarcinoma; THCA: Thyroid Carcinoma; PAAD: Pancreatic Adenocarcinoma; UVM: Uveal Melanoma; ( ): Low SNAI1 group; (
 ): High SNAI1 group.
Relationship between expression of SNAI1 gene and clinical features
The expression levels of SNAI1 were categorized into high and low groups and the statistical significance of various clinical features between these two groups was compared. High SNAI1 expression in LUSC showed a significant correlation with age, stage, T, N, M and survival time (days), survival status (p<0.05) (Table 1). Our findings suggest a significant correlation between SNAI1 expression and the expression of SNAI2 and SNAI3, indicating a potential relationship among members of the SNAI family. However, no significant correlation was observed between the expression levels of SNAI2 and SNAI3 and the prognosis of lung cancer patients (data not shown). Univariate and multivariate Cox regression analysis demonstrated that SNAI1 expression, age, stage, T, N, M were significantly associated with clinical prognosis. Therefore, the findings suggest that SNAI1 is an independent prognostic factor for patients with LUSC (Tables 2 and 3).
| Clinical features | N | SNAI1 mRNA | p-value | ||||
|---|---|---|---|---|---|---|---|
| High | Low | ||||||
| N | % | N | % | ||||
| Gender | Male | 492 | 180 | 73% | 184 | 75% | 0.757 |
| Female | 66 | 27% | 62 | 25% | |||
| Age | 492 | 69 | 63, 74 | 67 | 60, 73 | 0.03 | |
| ≤ 60 | 30 | 12% | 51 | 21% | 0.041 | ||
| >60 | 216 | 88% | 195 | 79% | |||
| T | T1 | 492 | 56 | 23% | 54 | 22% | 0.025 |
| T2 | 117 | 48% | 152 | 62% | |||
| T3 | 51 | 21% | 29 | 12% | |||
| T4 | 22 | 9% | 11 | 4% | |||
| Lymph node metastasis | N0 | 492 | 128 | 52% | 156 | 63% | 0.043 |
| N1 | 72 | 298% | 65 | 26% | |||
| N2 | 34 | 14% | 21 | 8.50% | |||
| N3 | 11 | 4% | 4 | 1.60% | |||
| Distant metastasis | M0 | 492 | 201 | 82% | 244 | 99% | <0.001 |
| M1 | 45 | 18% | 2 | 0.80% | |||
| Stage | I | 492 | 125 | 51% | 117 | 48% | 0.036 |
| II | 68 | 28% | 91 | 37% | |||
| III | 47 | 19% | 36 | 15% | |||
| IV | 6 | 2.40% | 2 | 0.80% | |||
| SNAI1 | 492 | 4.56 | 3.51, 6.72 | 1.62 | 1.14, 2.10 | <0.001 | |
| SNAI2 | 492 | 21 | 12, 30 | 22 | 16, 31 | 0.04 | |
| SNAI3 | 492 | 0.89 | 0.59, 1.36 | 0.55 | 0.36, 0.91 | <0.001 | |
| Survival time days | 492 | 470 | 211, 855 | 661 | 358, 1233 | <0.001 | |
| Survival status | Alive | 492 | 133 | 54% | 164 | 67% | 0.004 |
| Dead | 113 | 46% | 82 | 33% | |||
| HR | 95% CI | p-value | |
|---|---|---|---|
| SNAI1 | 1.046 | 1.014-1.078 | 0.004 |
| Age | 1.03 | 1.004-1.056 | 0.022 |
| Sex | 1.102 | 0.791-1.536 | 0.567 |
| Clinical stage | 1.269 | 1.07-1.504 | 0.006 |
| T stage | 1.37 | 1.141-1.645 | 0.001 |
| Lymph node metastasis | 1.213 | 1.008-1.473 | 0.048 |
| Distant metastasis | 1.852 | 1.13-3.034 | 0.014 |
| HR | 95% CI | p-value | |
|---|---|---|---|
| SNAI1 | 1.044 | 1.006-1.083 | 0.023 |
| Age | 1.019 | 1.001-1.038 | 0.036 |
| Clinical stage | 1.083 | 1.053-1.227 | 0.045 |
| T stage | 1.369 | 1.058-1.771 | 0.017 |
| Lymph node metastasis | 1.325 | 1.074-1.802 | 0.034 |
| Distant metastasis | 1.684 | 1.0096-2.807 | 0.046 |
Construction of a nomogram to predict the survival of patients with LUSC in order to help clinical diagnosis and treatment
To predict the survival outcomes of LUSC patients, a nomogram was constructed based on the results of multivariable Cox regression analysis. Statistical significant variables were included in the construction of the nomogram, which serves as a graphical prediction model for LUSC patients. The nomogram provides scores corresponding to different clinical and pathological characteristics of the patients. By summing up these scores, we can obtain a total score that predicts the Overall Survival (OS) of lung cancer patients at 1 and 2 years. The construction of this prediction model is based on the results of multivariable Cox regression analysis, which takes into account the influence of multiple variables and determines their independent contributions to survival rates. By incorporating these statistically significant variables into the model, we can more accurately predict the survival outcomes of LUSC patients (Figure 4).
High expression of SNAI1 protein in LUSC is associated with poor prognosis
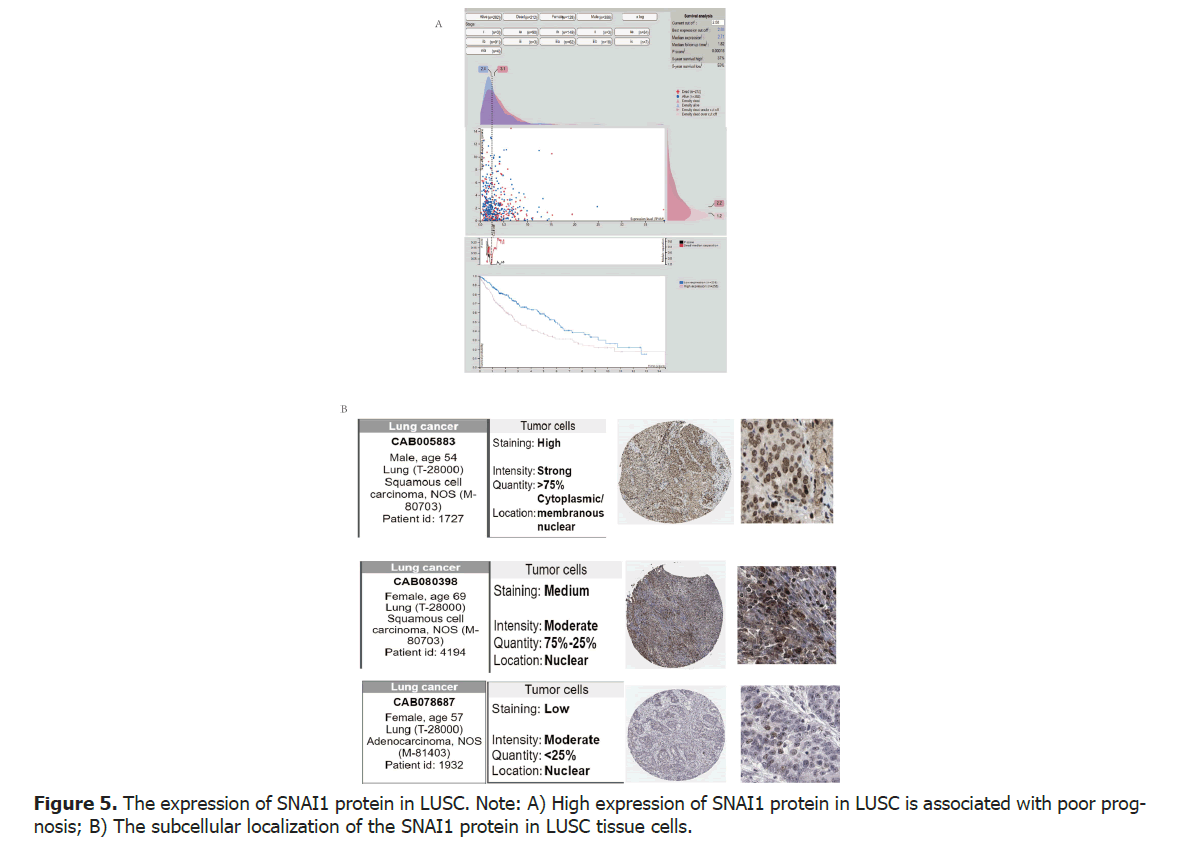
We have discovered a significant correlation between the levels of SNAI1 gene mRNA and the clinical prognosis of patients. To investigate the relationship between the expressions levels of SNAI1 protein and prognosis in patients with LUSC, the human protein atlas database for analysis. The research results demonstrate that high expression of SNAI1 protein in lung cancer is associated with poor prognosis. Specifically, the 5-year survival rate for patients in the high expression group of SNAI1 protein was 37%, while it was 59% for patients in the low expression group (p<0.05), indicating a significant statistical difference between the two groups. These findings conclude that high expression of SNAI1 protein is associated with poor prognosis in patients with LUSC (Figure 5A).
The primarily subcellular localization of the SNAI1 protein in LUSC tissue cells is the cell nucleus
To investigate the subcellular localization of the SNAI1 protein in LUSC tissue cells, the immunohistochemistry data from the human protein atlas database was utilized to analyze the expression of SNAI1 protein in patients with LUSC. The results found that regardless of low, moderate, or high expression levels, the SNAI1 protein is primarily localized in the cell nucleus. However, in cases of strong expression, cytoplasmic and membrane localization of the protein was also observed. Our findings demonstrate that in lung cancer tissue, the SNAI1 protein is predominantly localized in the cell nucleus, irrespective of its expression level. This nuclear localization suggests the importance of SNAI1 in gene transcription and regulation. However, it is worth noting that in cases of strong protein expression, we also observed cytoplasmic and membrane localization. This subcellular localization variation may be related to other functions or signaling pathways of SNAI1 in lung cancer (Figure 5B).
Biological mechanisms of SNAI1 in LUSC and its association with the P53 signaling pathway
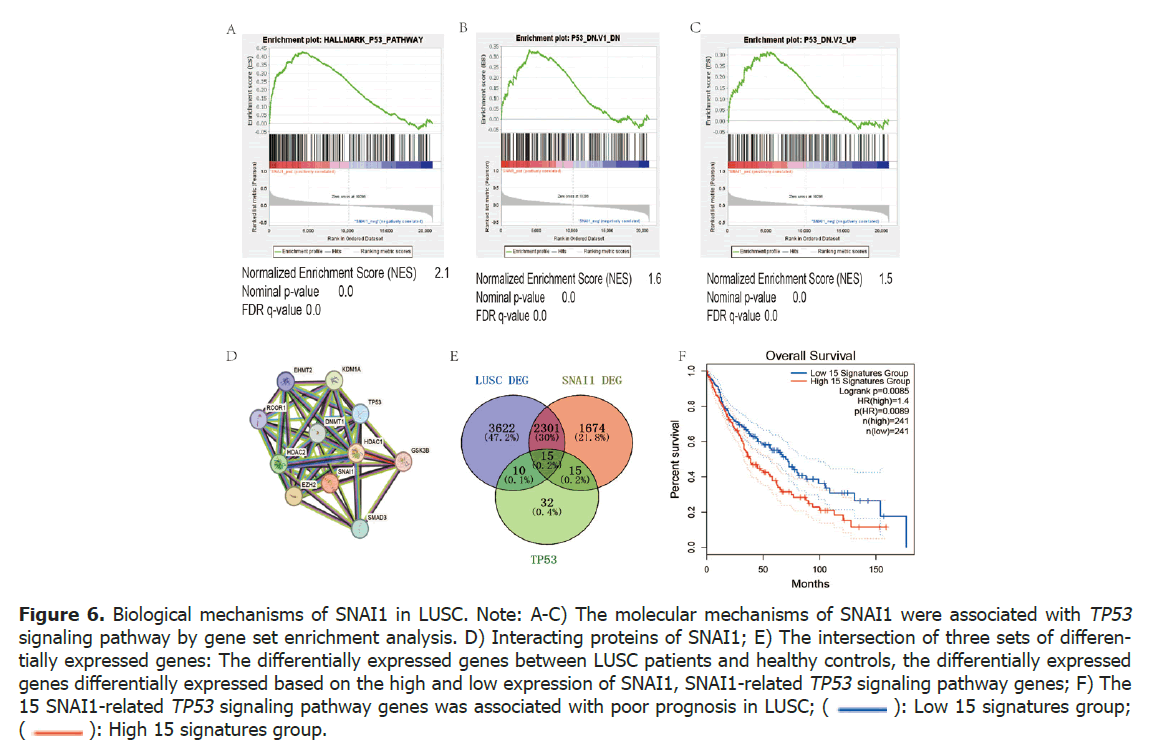
To investigate the molecular mechanisms of SNAI1, we conducted an analysis using gene set enrichment analysis to examine the relationship between SNAI1 expression and hallmark gene sets as well as oncogenic signature gene sets. Interestingly, our findings revealed a significant association between SNAI1 and the TP53 signaling pathway in both gene sets (Tables 4 and 5, Figures 6A-6C).
Figure 6. Biological mechanisms of SNAI1 in LUSC. Note: A-C) The molecular mechanisms of SNAI1 were associated with TP53 signaling pathway by gene set enrichment analysis; D) Interacting proteins of SNAI1; E) The intersection of three sets of differentially expressed genes: The differentially expressed genes between LUSC patients and healthy controls, the differentially expressed genes differentially expressed based on the high and low expression of SNAI1, SNAI1-related TP53 signaling pathway genes; F) The 15 SNAI1-related TP53 signaling pathway genes was associated with poor prognosis in LUSC; ( ): Low 15 signatures group; (
 ): High 15 signatures group.
| Name | ES | NES | p-value | FDR q-val |
|---|---|---|---|---|
| HALLMARK_TNFA_SIGNALING_VIA_NFKB | 0.44 | 2.09 | 0 | 0 |
| HALLMARK_EPITHELIAL_MESENCHYMAL_TRANSITION | 0.42 | 2.06 | 0 | 0.001 |
| HALLMARK_P53_PATHWAY | 0.43 | 2.06 | 0 | 0.001 |
| HALLMARK_HYPOXIA | 0.4 | 1.94 | 0 | 0.001 |
| HALLMARK_REACTIVE_OXYGEN_SPECIES_PATHWAY | 0.47 | 1.81 | 0.002 | 0.002 |
| HALLMARK_UV_RESPONSE_UP | 0.35 | 1.65 | 0 | 0.013 |
| HALLMARK_INFLAMMATORY_RESPONSE | 0.33 | 1.63 | 0 | 0.013 |
| HALLMARK_GLYCOLYSIS | 0.31 | 1.48 | 0.005 | 0.047 |
| HALLMARK_INTERFERON_GAMMA_RESPONSE | 0.28 | 1.38 | 0.01 | 0.113 |
| HALLMARK_APICAL_JUNCTION | 0.28 | 1.35 | 0.027 | 0.121 |
| HALLMARK_ADIPOGENESIS | 0.28 | 1.35 | 0.023 | 0.113 |
| HALLMARK_COMPLEMENT | 0.28 | 1.34 | 0.025 | 0.107 |
| Name | ES | NES | p-value | FDR q-val |
|---|---|---|---|---|
| TGFB_UP.V1_UP | 0.44 | 2.11 | 0 | 0 |
| PRC2_EZH2_UP.V1_UP | 0.41 | 1.99 | 0 | 0.001 |
| MEL18_DN.V1_UP | 0.4 | 1.83 | 0 | 0.006 |
| RELA_DN.V1_UP | 0.39 | 1.82 | 0 | 0.005 |
| BMI1_DN_MEL18_DN.V1_UP | 0.39 | 1.79 | 0 | 0.005 |
| P53_DN.V1_DN | 0.34 | 1.65 | 0 | 0.026 |
| STK33_NOMO_UP | 0.31 | 1.59 | 0 | 0.046 |
| CAHOY_ASTROGLIAL | 0.37 | 1.57 | 0.007 | 0.048 |
| ESC_V6.5_UP_EARLY.V1_DN | 0.33 | 1.54 | 0.002 | 0.063 |
| IL2_UP.V1_UP | 0.32 | 1.51 | 0 | 0.08 |
| VEGF_A_UP.V1_UP | 0.31 | 1.5 | 0.002 | 0.081 |
Interaction between SNAI1 and TP53, epigenetic modification proteins
Protein-protein interaction analysis of SNAI1 was conducted using the online tool string 10.0 from the Protein-protein interaction database (http://www. string-db.org/). The analysis revealed several proteins that interact with SNAI1, including TP53, epigenetic modification (EZH2, HDAC1, HDAC2, KDM1A), JUN, MTA3 (Figures 6A-6D).
The role of the SNAI1-related TP53 signaling pathway gene set in LUSC
GSEA analysis revealed a correlation between the expression of SNAI1 and the abnormal expression of key genes in the TP53 signaling pathway. To investigate the role of the SNAI1-related TP53 signaling pathway gene set in lung cancer, the intersecting gene sets were obtained by comparing the expression of the gene sets related to the TP53 signaling pathway, the differentially expressed genes in LUSC patients and normal healthy controls, as well as the differentially expressed gene sets based on the high and low expression of SNAI1 (Figure 6E).
The total number of differentially expressed genes between LUSC patients and healthy controls was 5948. There were 4005 genes differentially expressed based on the high and low expression of SNAI1. The intersection of these three sets of differentially expressed genes revealed 15 common genes: ABCC5, AK1, ATF3, FAS, PPP1R15A, NDRG1, SLC19A2, STOM, ST14, FDXR, TGFA, RRAD, PLK3, JUN, TXNIP.
Prognostic analysis was performed to assess the relationship between these 15 genes and the prognosis of LUSC patients. It was found that the expression of these 15 genes was associated with poor prognosis in LUSC. This suggests that the SNAI1-related TP53 signaling pathway gene set in LUSC is associated with poor prognosis in patients with LUSC (Figure 6F).
Identification of potential molecular targeted drugs for SNAI1
By utilizing the CellMiner platform, we were able to explore a wide range of compounds that could potentially target SNAI1, including mTOR (Supplementary Table 1). The mechanistic Target of Rapamycin (mTOR) is a central signaling pathway that plays a crucial role in regulating cell proliferation and survival. In the context of lung cancer, it has been reported that mTOR is frequently overexpressed. Therefore, targeting the mTOR pathway for down-regulation has emerged as a promising strategy in lung cancer therapy [11-15].
Protein-protein interactions have revealed that TP53, Histone Deacetylase (HDAC), HDAC1 and HDAC2 interact with SNAI1, suggesting that they could be potential target molecules of SNAI1. Among these compounds, HDAC inhibitors emerged as promising candidates. HDAC inhibitors are known to modulate gene expression by altering chromatin structure and function, which may play a crucial role in regulating SNAI1 activity. Numerous preclinical and clinical studies have demonstrated that HDAC inhibitors can be used alone or in combination for the treatment of lung cancer, showing remarkable therapeutic efficacy. Many ongoing clinical trials are further evaluating the profound impact of HDAC inhibitors on the treatment outcomes of lung cancer (Supplementary Tables 2 and 3).
Discussion
This study found that SNAI1 is most abundantly expressed in lung tissue compared to other organs. This finding suggests a potential role for SNAI1 in the regulation and functioning of lung tissue. However, the exact function of SNAI1 in normal lung tissue cells remains unclear. The expression of SNAI1 was significantly downregulated in LUSC. Abnormal expression of SNAI1 has been observed in various tumours compared to normal control tissues. Both LUSC and adenocarcinoma showed significant downregulation of SNAI1 expression.
High expression of the SNAI1 mRNA is significantly associated with poor Overall Survival (OS) and Disease- Free Survival (DFS) in patients with LUSC, indicating its negative prognostic impact. Similar associations between high SNAI1 gene expression and poor OS/DFS have been observed in various other tumours. Stratified analysis using X-tile software on SNAI1 gene expression revealed distinct survival outcomes among groups with high, medium, or low expressions of SNAI1.
The SNAI1 mRNA expression was significantly correlated with age and distant metastasis. Univariate Cox regression analysis found that SNAI1 expression along with age, T stage, lymph node metastasis, distant metastasis were all significantly associated with clinical prognosis. Multivariate Cox regression analysis further confirmed that SNAI1 expression along with age, T stage, lymph node metastasis, distant metastasis were independent prognostic factors.
The high expression of SNAI1 protein in lung cancer is also associated with poor prognosis. The 5-year survival rate for patients in the high expression group of SNAI1 protein was 37%, compared to 59% for patients in the low expression group. These research findings conclude that the high expression of SNAI1 protein is associated with poor prognosis in patients with LUSC. The primarily subcellular localization of the SNAI1 protein in LUSC tissue cells is the cell nucleus, but strong protein expression also leads to cytoplasmic and membrane localization of SNAI1. This variation in subcellular localization may be associated with other functions or signaling pathways of SNAI1 in lung cancer. To better understand this phenomenon, further research is needed on the functions and regulatory mechanisms of the SNAI1 protein. Firstly, we can consider the role of SNAI1 in the cell nucleus. As a transcription factor, SNAI1 regulates gene transcription in the cell nucleus and is involved in the process of Epithelial-Mesenchymal Transition (EMT), which is closely associated with cell morphological changes and tumour invasion and metastasis. However, the cytoplasmic and membrane localization of SNAI1 suggests that this protein may also play a role in other cellular functions and signaling pathways. The cytoplasmic localization may be related to the degradation, post-translational modifications, and intercellular signaling of SNAI1. The membrane localization may involve the regulation of SNAI1 in interaction with other cell surface receptors or intercellular interactions. Furthermore, the variation in subcellular localization of SNAI1 may also be associated with the development and prognosis of LUSC. So, the variation in subcellular localization of the SNAI1 protein in LUSC may be associated with its multiple functions and signaling pathways involved in tumour development, invasion and metastasis. Further research on the localization mechanisms and functional regulation of SNAI1 will contribute to a better understanding of the occurrence and progression of LUSC.
Gene Set Enrichment Analysis (GSEA) revealed relevance between SNAI1 and TP53 signaling pathway in LUSC. SNAI1 can interact with TP53, key regulators of epigenetic proteins (EZH2, HDAC1, HDAC2, KDMIA) to exert biological functions. The TP53 signaling pathway is one of the main cellular apoptosis signaling pathways that plays a crucial role in various tumours and is known as the guardian of life [16-25].
Conclusion
The interaction between SNAI1 and TP53 may contribute to the aggressive behaviour of cancer cells. Furthermore, SNAI1’s interactions with HDAC1 and HDAC2 suggest its involvement in chromatin re-modelling and transcriptional regulation. The recruitment of histone deacetylases by SNAI1 can lead to epigenetic changes that promote tumour cell survival and metastasis. Therefore, potential targeted drugs for SNAI1 include epigenetic modifications inhibitors and mTOR. Studies have shown that these targeted SNAI1 agents hold promise for the treatment of lung cancer.
Availability of Data and Materials
The data and materials are available from the corresponding author on reasonable request.
Competing Interests
The authors declare no competing interests.
Funding
This study was supported by the Construction Project KHGMY1357647 from the Medical Science and Technology Research of Celement Project and Health Commission.
Authors’ Contributions
(I) Conception and design: Caren and Maigna; (II) Administrative support: Caren; (III) Data analysis and interpretation: Caren; (IV) Manuscript writing: Caren; (V) Final approval of manuscript: All authors.
Acknowledgements
We thank the editor and reviewers for relevant and helpful comments on the manuscript.
References
- Siegel RL, Miller KD, Wagle NS, Jemal A. Cancer statistics, 2023. CA Cancer J Clin. 2023; 73(1): 17-48.
[Crossref] [Google Scholar] [Indexed]
- Zheng RS, Zhang SW, Sun KX, Chen R, Wang SM, Li L, et al. Cancer statistics in China, 2016. Zhonghua Zhong Liu Za Zhi. 2023; 45(3): 212-220.
[Crossref] [Google Scholar] [Indexed]
- Yang J, Li H, Zheng RS, Zeng HM, Zhang SW, Yang ZX, et al. Analysis of the clinical characteristics of 8 081 primary lung cancer. Zhonghua Zhong Liu Za Zhi. 2019; 41(6): 471-476.
[Crossref] [Google Scholar] [Indexed]
- World Health Organization (WHO) International agency for research on cancer today.
- Wang X, Liu R, Zhu W, Chu H, Yu h, Wei P, et al. UDP-glucose accelerates SNAI1 mRNA decay and impairs lung cancer metastasis. Nature. 2019; 571(7763): 127-131.
[Crossref] [Google Scholar] [Indexed]
- Zhu Y, Wang C, Becker SA, Hurst K, Nogueira LM, Findalu EJ, et al. miR-145 antagonizes SNAI1-mediated stemness and radiation resistance in colorectal cancer. Mol Ther. 2018; 26(3): 744-754.
[Crossref] [Google Scholar] [Indexed]
- Liu T, Xu P, Ke S, Dong H, Zhan M, Hu Q, et al. Histone methyltransferase SETDB1 inhibits TGF-β-induced epithelial-mesenchymal transition in pulmonary fibrosis by regulating SNAI1 expression and the ferroptosis signaling pathway. Arch Biochem Biophys 2022; 715: 109087.
[Crossref] [Google Scholar] [Indexed]
- Dong B, Wu Y. Epigenetic regulation and post-translational modifications of SNAI1 in cancer metastasis. Int J Mol Sci. 2021; 22(20): 11062.
[Crossref] [Google Scholar] [Indexed]
- Tsirigoti C, Ali MM, Maturi V, Heldin CH, Moustakas A (2022) Loss of SNAI1 induces cellular plasticity in invasive triple-negative breast cancer cells. Cell Death Dis. 2022; 13(9): 832.
[Crossref] [Google Scholar] [Indexed]
- Singh D, Deshmukh RK, Das A SNAI1-mediated transcriptional regulation of epithelial-to-mesenchymal transition genes in breast cancer stem cells. Cell Signal. 2021; 87: 110151.
[Crossref] [Google Scholar] [Indexed]
- Ghareghomi S, Atabaki V, Abdollahzadeh N, Ahmadian S, Ghoran SH. Bioactive PI3-kinase/Akt/mTOR inhibitors in targeted lung cancer therapy. Adv Pharm Bull 2023; 13: 24-35.
[Crossref] [Google Scholar] [Indexed]
- Thomas A, Liu SV, Subramaniam DS, Giaccone G. Refining the treatment of NSCLC according to histological and molecular subtypes. Nat Rev Clin Oncol. 2015; 12(9): 511-526.
[Crossref] [Google Scholar] [Indexed]
- Alzahrani AS. PI3K/Akt/mTOR inhibitors in cancer: At the bench and bedside. Semin Cancer Biol. 2019; 59: 125-132.
[Crossref] [Google Scholar] [Indexed]
- Gridelli C, Maione P, Rossi A. The potential role of mTOR inhibitors in non-small cell lung cancer. Oncologist. 2008; 13(2): 139-147.
[Crossref] [Google Scholar] [Indexed]
- Memmott RM, Dennis PA. The role of the Akt/mTOR pathway in tobacco carcinogen-induced lung tumorigenesis. Clin Cancer Res 2010; 16(1): 4-10.
[Crossref] [Google Scholar] [Indexed]
- Thoenen E, Curl A, Iwakuma T. TP53 in bone and soft tissue sarcomas. Pharmacol Ther 2019; 202: 149-164.
[Crossref] [Google Scholar] [Indexed]
- Donehower LA, Soussi T, Korkut A, Liu Y, Schultz A, Cardenas M, et al. Integrated analysis of TP53 gene and pathway alterations in the cancer genome atlas. Cell Rep. 2019; 28(5): 3010.
[Crossref] [Google Scholar] [Indexed]
- Shahbandi A, Nguyen HD, Jackson JG. TP53 mutations and outcomes in breast cancer: Reading beyond the headlines. Trends Cancer. 2020; 6: 98-110.
[Crossref] [Google Scholar] [Indexed]
- Long J, Wang A, Bai Y, Lin J, Yang X, Wang D, et al. Development and validation of a TP53-associated immune prognostic model for hepatocellular carcinoma. EBioMedicine. 2019; 42: 363-374.
[Crossref] [Google Scholar] [Indexed]
- Grob T, Al Hinai ASA, Sanders MA, Kavelaars FG, Rijken M, Gradowska PL, et al. Molecular characterization of mutant TP53 acute myeloid leukemia and high-risk myelodysplastic syndrome. Blood. 2022; 139(15): 2347-2354.
[Crossref] [Google Scholar] [Indexed]
- Barbosa K, Li S, Adams PD, Deshpande AJ. The role of TP53 in acute myeloid leukemia: Challenges and opportunities. Genes Chromosomes Cancer. 2019; 58(120: 875-888.
[Crossref] [Google Scholar] [Indexed]
- Wang Z, Strasser A, Kelly GL. Should mutant TP53 be targeted for cancer therapy? Cell Death Differ. 2022; 29(5): 911-920.
[Crossref] [Google Scholar] [Indexed]
- Kim K, Maiti A, Loghavi S, Pourebrahim R, Kadia TM, Rausch CR, et al. (2021) Outcomes of TP53-mutant acute myeloid leukemia with decitabine and venetoclax. Cancer 2021; 127(20): 3772-3781.
[Crossref] [Google Scholar] [Indexed]
- Granowicz EM, Jonas BA. Targeting TP53-mutated acute myeloid leukemia: Research and clinical developments. Onco Targets Ther 2022; 15: 423-436.
[Crossref] [Google Scholar] [Indexed]
- Hunter AM, Sallman DA. Current status and new treatment approaches in TP53 mutated AML. Best Pract Res Clin Haematol 2019; 32(2): 134-144.
[Crossref] [Google Scholar] [Indexed]
Author Info
Caren SELIGMAN* and Mainga MAITLANDCopyright: This is an open access article distributed under the terms of the Creative Commons Attribution License, which permits unrestricted use, distribution, and reproduction in any medium, provided the original work is properly cited.
Google Scholar citation report
Citations : 2439
Clinical Nutrition and Hospital Dietetics received 2439 citations as per google scholar report
Indexed In
- Google Scholar
- Open J Gate
- Genamics JournalSeek
- Academic Keys
- JournalTOCs
- ResearchBible
- SCOPUS
- Ulrich's Periodicals Directory
- Access to Global Online Research in Agriculture (AGORA)
- Electronic Journals Library
- RefSeek
- Hamdard University
- EBSCO A-Z
- OCLC- WorldCat
- SWB online catalog
- Virtual Library of Biology (vifabio)
- Publons
- MIAR
- Geneva Foundation for Medical Education and Research
- Euro Pub
- Web of Science
Journal Highlights
- Blood Glucose
- Dietary Supplements
- Cholesterol, Dehydration
- Digestion
- Electrolytes
- Clinical Nutrition Studies
- energy balance
- Diet quality
- Clinical Nutrition and Hospital Dietetics


